Summary:
In the grain temperature measurement of traditional grain storehouse, the indoor positioning accuracy of the temperature measurement node depends on a large number of beacon nodes, which brings great inconvenience to the actual engineering application. In order to simplify the application model, a differential location model was established based on the distance attenuation curve characteristics of radio waves, and a location estimation method for grain temperature measurement nodes based on Received Signal Strength Indication (RSSI) differential location model was proposed. The model adopts a dynamic beacon node to determine the nearest unknown node of the beacon node in sequence according to the RSSI value, and eventually realizes the positioning of all the nodes. Experiments show that the RSSI differential positioning model based on the temperature measurement node of the grain store does not need to place additional beacon nodes, which can reduce the environmental random error, and the positioning accuracy is higher than the traditional distance measurement and positioning model.

0 Preface
The issue of food security is the country’s long-term development strategy, and food storage is one of the key factors in food security. Safe grain storage mainly monitors the temperature and humidity of the grain piles inside the grain storehouse. When the temperature in a certain area is monitored to increase, corresponding reduction measures are taken [1-2]. At present, grain storage temperature measuring equipment is manually numbered to identify the location after each grain storage, which requires a lot of manpower and material resources and low reliability.
In recent years, with the rapid development of wireless sensor network technology, more and more researchers have begun to pay attention to indoor positioning research. Indoor positioning is mainly divided into two types, one is a positioning model based on ranging: for example, arrival time, arrival time difference, arrival angle, RSSI, etc.; the other is a non-ranging positioning model, such as DV-Hop, centroid algorithm model [3-6]. The positioning accuracy of the ranging positioning model is higher than that of the non-ranging positioning model. In addition to the RSSI in the ranging positioning model, most of the ranging positioning models require additional hardware.
According to the requirements of low power consumption, low cost and high positioning accuracy of temperature measurement nodes in grain storage, this paper adopts RSSI positioning model. Based on the wireless sensor network hardware, the RSSI distance attenuation curve is analyzed. The dynamic beacon node is used to improve the accuracy of the ranging model, and the differential positioning model is used to reduce the environmental error. The comparison experiments show that in the experimental environment, the differential location algorithm only needs one auxiliary beacon node to achieve the accuracy of the traditional ranging location model in 13 beacon nodes [7].
1 grain warehouse wireless temperature measurement node design
The thickness of grain is 5-7 m when the grain warehouse is full, and the nodes are placed every 4 to 5 m at equal intervals on the upper grain plane. Each node collects the temperature of the upper and lower four locations. This article uses the CC1101 micro-power wireless transceiver module to directly read the RSSI value during the communication process. Temperature measurement using DS18b20 single bus digital temperature sensor, each node is configured with four DS18b20, equally spaced above and below. All temperature measuring nodes are powered by lithium batteries and can be independently moved and replaced with each other.
2 algorithm model
2.1 Radio propagation path loss model
The model based on RSSI ranging is mainly used to calculate the signal propagation loss by transmitting and receiving signal strengths. The value of signal transmission loss increases with the propagation distance in the same propagation environment. The signal propagation path loss model can be used to spread the signal. The loss value is converted into a distance value. The normal distribution model usually used in the RSSI attenuation model:

From formula (5) we can see that RSSI values ​​are related to A, n, d, and Xδ, where A and n are greatly affected by environmental factors. The traditional method uses fixed A and n to establish a model for distance d and the actual environment is not Conformity, resulting in greater distance model error, while being interfered by Gaussian random error Xδ. In order to reduce the error caused by the above factors, Kalman filtering is performed on the obtained RSSI value, and then the differential interference is used to reduce the interference of environmental factors, and the precise position of the target node is obtained.
2.2 Processing of RSSI
RSSI is a model established by the received signal strength indication based on the path loss of the radio propagation in free space, and its value is inversely proportional to the propagation distance of the radio wave. The experimental node of this article is built with TI's CC1101 micro power module. The rssidev value in the communication process can be directly read from the internal register of the module. Its value range is 0-255. From reference [8], it can be seen that rssidbm and rssidev have the following relationship:

The rssidev is the hexadecimal number read by the CC1101 internal register. The rssidbm is the converted decimal signal received strength value. The rssioff value is 74. In order to facilitate the establishment and solution of the model, rssidbm is treated as follows:
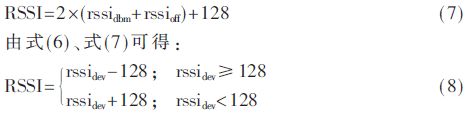
The RSSI value is obtained through the above processing, and its value range is 0-255 with higher resolution than RSSI.
2.3 Differential Positioning Model
Since the RSSI value is affected by factors such as temperature, humidity, and multipath effects of the environment, it is difficult to establish an RSSI ranging and positioning model suitable for all situations. According to the situation of temperature measurement nodes in the grain storehouse, this paper proposes a RSSI-based differential location model based on the traditional ranging location model.
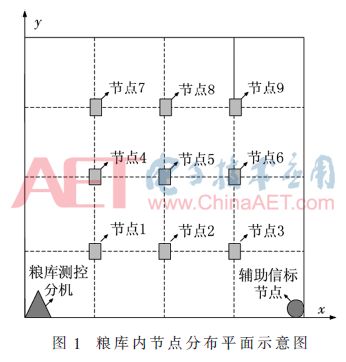
As shown in Fig. 1, the temperature measurement nodes in the grain store are arranged at equal intervals, and the positions of the grain store measurement and control extensions and the auxiliary beacon nodes are known as the beacon nodes S1 and S2 respectively, and only the distance beacon nodes need to be determined in order. The nearest location node, as a new beacon node, can be cycled in order to determine the location coordinates of all temperature measurement nodes in the grain store.
Assuming that the distance between node 2 and node 4 from the beacon node S1 is d1 and d2, respectively, according to equation (1):
Comparison formulas (5) and (10) show that the difference between the RSSI values ​​of node 2 and node 4 and the beacon node S1 is only related to their distances d1, d2 and n, and n at the same time can be considered as a certain value. Therefore, using the RSSI differential positioning algorithm can effectively suppress the interference of Xδ in equation (5).
From Equation (10), the relative sizes of d1 and d2 can be known from the size of the resident RSSI. Similarly, the beacon node can search for the nearest unknown node by comparing with the RSSI values ​​of all the unknown nodes. They do not rely on traditional ranging methods and can adapt to a variety of changing location environments.
As shown in Figure 1, Node 1 to Node 9 are arranged at equal intervals in the grain storehouse. Grain storehouse measurement and control extensions and auxiliary beacon nodes are arranged at known locations. The differential location model and dynamic beacon node selection scheme proposed in this paper are as follows: :
(1) Select the grain warehouse monitoring and control extensions and auxiliary beacon nodes at known locations as dynamic beacon nodes S1 and S2. The nearest node with the closest RSSI value is searched by Equation (10), that is, the node with the largest RSSI value. Because the RSSI value is the largest when the node 1 communicates with S1, and the RSSI value is the maximum when the node 3 communicates with the S2, the positions of the node 1 and the node 3 can be determined.
(2) Let node 1 and node 3 be beacon nodes S1 and S2, respectively, and search for nodes closest to them in the unknown node.
(3) The node closest to S1 in the search result has node 2 and node 4, and the node closest to S2 has node 2 and node 3. After the comparison, it is found that the distance from node 2 to S1 and S2 is equal, and it can be determined that node 2 is at the midpoint of S1 and S2, and further that three temperature measurement nodes are arranged in the x-axis direction, and the position of node 2 can be determined. Further the positions of node 4 and node 6 are also determined and they are determined as new beacon nodes S1 and S2.
(4) Cycle through steps 2 and 3 above until all nodes are positioned.
3 Experimental verification and analysis
The experiment uses TI's CC1101 chip to test in the open frequency band of 433 MHz, and the RSSI value is obtained by using the 8-bit RSSI register in the chip. In order to reduce the influence of space radio waves on the communication channel and affect the test data, the clear channel assessment mechanism ensures that the channel is idle before each test.
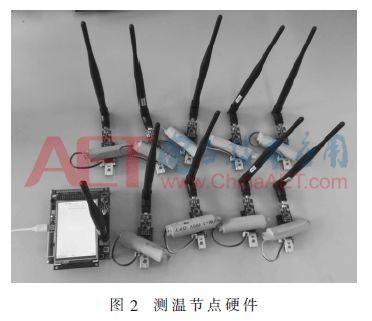
Figure 2 shows the temperature measurement node used in this experiment. The hardware uses CC1101 communication module and STM8L101 microcontroller and 18650 lithium battery.
3.1 Data Processing
The experiment chose to measure a set of RSSI data every 0.5 m, and each group measured 100 times the value. The data collected in each group was processed. The usual methods of processing were average method and sub-maximal value method.
In order to select a processing method that is more suitable for RSSI values, the curve of FIG. 3 is obtained using the mean value method, the second largest value method, and the least squares method three times of fitting values.
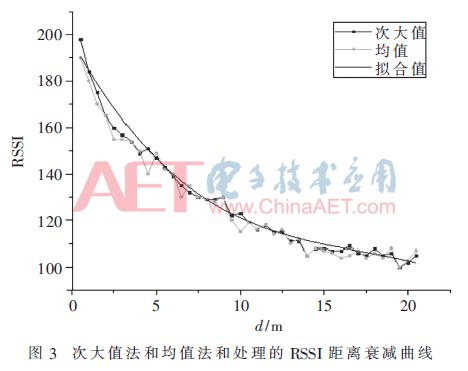
It can be clearly seen from Fig. 3 that the attenuation curve of the second largest value method is smaller than that of the mean method, and it is more consistent with the curve obtained by least squares fitting. Therefore, this paper adopts the second largest value method and ranks the largest value of each group of 100 data as the test result of the group.
In order to further reduce the random error, Kalman filtering is performed on the results obtained by the second largest value method. The experimental results are shown in FIG. 4 . Figure 4 shows that the Kalman filtered attenuation curve is smoother and closer to the fitting value. In order to measure the effect of Kalman filtering, Mean-Square Error (MSE) is usually used to measure.
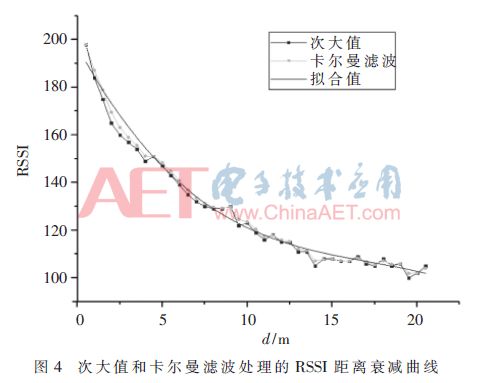
Before Kalman filtering: MSE=9.7109
After Kalman filtering: MSE=3.6797
According to the MSE calculation result, the Kalman filter before the MSE value is larger than the Kalman filtered value, so it can be proved that the Kalman filter significantly improves the credibility of the RSSI value.
By observing the RSSI distance attenuation curve in Fig. 4, it can be seen that the closer the communication distance is, the greater the signal attenuation is. The communication distance in the range of 0 to 10 m accounts for 50% of the total test distance, but the signal attenuation value accounts for 80 of the total test attenuation. %, from which it can be concluded that the closer the beacon node is to the located node, the higher its positioning accuracy. In order to improve the positioning accuracy, the dynamic beacon node is used to select the node closest to the located node as the beacon node. In this model of differential positioning, the dynamic beacon node scheme is used to select the closest known node from the node to be located as the beacon. Nodes improve positioning accuracy.
3.2 Differential positioning experiment
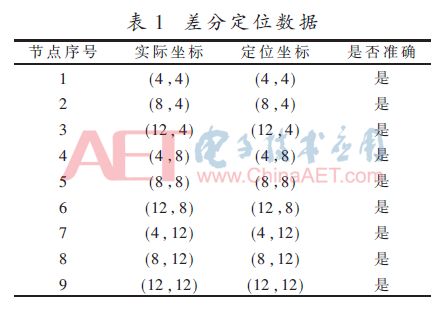
As shown in Fig. 1, 9 temperature measuring nodes are arranged in a 16 m×16 m grain store. The grain store monitoring and control extension and the auxiliary beacon node define the position of the grain library measurement and control extension as the origin of coordinates, and the differential positioning proposed in Section 2.3. The model is positioned.
Differential positioning model calculates the relative distance between RSSI values ​​of different unknown nodes and beacons by comparing the relative sizes of RSSI values ​​between them. This avoids the large error caused by converting RSSI values ​​into distances. From the test results of the differential positioning model shown in Table 1, the following conclusions can be drawn: (1) The differential positioning scheme uses nodes at known positions as the beacon nodes to ensure the communication distance within 10 m, providing guarantee for the improvement of positioning accuracy; (2 ) The differential positioning model does not require manual intervention in the positioning process, and the accuracy does not depend on the beacon section of the layout.
3.3 Comparison of Differential Positioning and Traditional Range Positioning Results
In the experimental environment of Section 3.2, the traditional distance measurement positioning method was adopted, and the effect of the number of beacon nodes arranged on the positioning accuracy was studied. The temperature measurement nodes of the grain storehouse are equally spaced, so the positioning results of the traditional distance measurement and positioning model are considered to be accurate as long as they fall within a radius of 1 m centered on the actual coordinates of the measured node. Table 2 shows the statistics of the number of beaconing nodes and the number of incorrect positioning results.
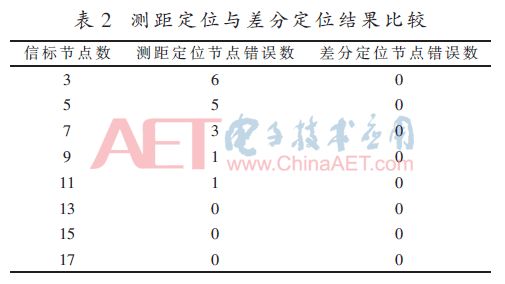
Comparison of the data in Table 2 shows that under the same environment, the accuracy of the traditional ranging location model increases with the number of beacon nodes. After the number of beacon nodes exceeds 13, the node location error rate decreases to zero. The differential location model requires only one auxiliary positioning node and grain library measurement and control extension. In the positioning process, the nearest known node from the located node is automatically used as a beacon node, and the final node positioning error rate is zero.
4 Conclusion
In order to solve the positioning problem of temperature measurement nodes in grain storage, a RSSI-based differential localization algorithm for temperature measurement nodes was proposed. By comparison, a better secondary value method for data processing was selected, and the Kalman filter was used to reduce Gaussian error. The data is processed, and finally the RSSI difference method is used to reduce the environmental interference, and the effectiveness of the differential location algorithm is proved through experiments. The solution of the grain store temperature measurement and the like is solved by adopting a dynamic beacon node solution without increasing a large number of beacon nodes. The problem of locating wireless nodes with equal spacing.
The Fume EXTRA is original 1500 puff salt nicotine disposable vape that comes in a variety of incredible flavors to choose from. This device is great for beginners looking to switch to a vape that doesn`t require any filling or charging. Whether you`re a beginner looking to quit traditional cigarettes or you`re an experienced user wanting maximum puffs, this is the perfect vape to complement your lifestyle. It`s also great for traveling and for those wanting a more discrete vaping experience. Sometimes the original is all you need for everyday puffing.
fume extra vape disposable,fume extra vape kit,fume extra vape strawberry mango,fume extra vape battery,fume extra vape hits
Ningbo Autrends International Trade Co.,Ltd. , https://www.mosvapor.com