The digital instrument has a simple structure and is easy to use, and has been widely used in scientific experiments and production. In order to improve the verification efficiency and verification accuracy, it is necessary to realize automatic verification. Since the verification of digital instruments is a large-scale and repetitive inspection process, its operation process is simple and standardized, and the external environment requirements are not high, which provides favorable conditions for realizing verification automation. The continuous development of computer vision technology and digital image processing technology in recent years has provided the possibility to meet the above requirements. The camera is used to complete the acquisition of the dial and the background image, and convert it into a digital signal, and then use the digital image processing technology to achieve key operations, realize the automatic verification of the digital instrument, improve the verification accuracy, production efficiency, and reduce the production cost. The automatic real-time recognition system for meter display values ​​developed in this paper mainly includes three parts: image preprocessing, feature extraction and digital recognition. Among them, digital recognition is a key part, mainly adopting the support vector machine method in learning theory. Learning theory is a theory that studies the nature and laws of machine learning in the case of finite samples. Under this theory, a general-purpose pattern classifier, support vector machine, has the advantages of strong promotion ability and global optimization compared with the traditional pattern recognition method, which makes the support vector machine technology Digital recognition systems have a good application prospect, which has aroused great interest from scholars at home and abroad. The support vector machine better solves the contradiction between the complexity and the generalization of the pattern classifier through the structural risk minimization criterion and the kernel function method, and thus has attracted great attention from scholars in the field of pattern recognition.
1 instrument indicates the value of automatic identification principle instrument display value automatic real-time identification system flow: First, the video frame displayed by the camera is obtained by the camera; then, the video frame is gray-scale transformed, binarized to obtain binary image; and then edge detection The differential histogram is operated, the horizontal and vertical projections of the dial are calculated, the peak and valley analysis is performed to locate the digital area, and the binary image of the single number is segmented; the feature extraction of the image of the single number is performed to obtain a set of features; finally, The feature is sent to the recognizer for identification.
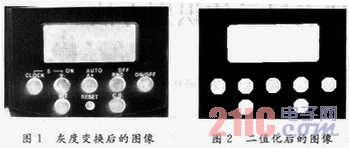
1.1 Pre-Processing Digital Meters During the verification process, you first locate the dial area and then determine the digital position. After the image is extracted by the camera, after grayscale transformation (see Figure 1) and binarization (see Figure 2), the effect will have a direct impact on subsequent digital segmentation and feature extraction, where binarization is image preprocessing. The key link is affected by factors such as the brightness of the indoor lighting and the instrument screen itself in the actual application. In the image, there are often cases of uneven gray scale distribution and gray scale mutation. In this paper, the OTSU algorithm is used to obtain a good binary image according to the maximum variance binarization, here mainly to extract the dial area. By identifying the connected area, the circumscribed rectangle of the connected area, and then positioning the display area of ​​the digital meter according to the length and width of the circumscribed rectangle. This paper uses an 8-connected region extraction algorithm. Firstly, the image is scanned according to a certain labeling rule to obtain a certain number of connected regions; then, the processing is performed for the case where the labels in the same region are inconsistent, that is, the final processing result is obtained.
This article refers to the address: http://
1.2 After the digital split dial area is split, continue to divide the digital area. In practical applications, the camera is fixed, and the position, size, etc. of the digital display area in the image are substantially similar. According to the characteristics of the digital display screen, this paper uses the projection method to find the border of the display. Accurate positioning and segmentation of digital regions in images is an important prerequisite for the recognition of instrument display values. In the binary map of the dial, the edge detection is performed first, and the differential histogram is used for digital segmentation. FIG. 3 is a histogram after horizontal projection.

After horizontal projection, the image is divided into upper, middle and lower parts. The binary image of the central digital region is scanned line by line from top to bottom; a horizontal projection image of the image is obtained. By using the horizontal projection gap formed by the inter-row spacing, the digital lines can be separated, as shown in FIG. 4, and then the middle screenshot is extracted, and then the central digital area is vertically projected. As shown in FIG. 5, the peak and valley can be calculated. Split a single number. After the word cut is divided from the line, each number is segmented in the obtained image, and the numbers are separated by the gap between the characters in the vertical projection of each line of characters.

1.3 Feature Extraction Because the numbers have obvious local structural features, this paper uses an asymmetric block statistical feature as the feature vector for characterizing numbers. Methods as below:
(1) Applying the otsu method to binarize the segmented digital image, and then normalizing the image to a size of 70×50;
(2) Dividing the picture into 35 pieces, each sub-picture is 10×10 size, and calculating the distribution characteristics of the background points in each block according to the formula (1); 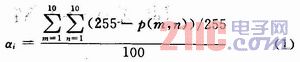
Where: p(m,n) is the gray value of m rows and n columns of pixels in the 10×10 subgraph, the front spot is 255, and the background point is 0.
(3) Using the background point statistical feature of each subgraph as a one-dimensional feature vector, construct a 35-dimensional vector [a1 a2 ... a34 a35] as the input feature vector of the support vector machine.
1.4 Digital Recognition Support Vector Machines (SVM) based on support vector machine (SVM) works based on structural risk minimization criteria, which can achieve a better balance between training error and classifier capacity, and thus have better performance. It has a wide range of applications in the field of pattern recognition. For both types of pattern recognition problems, assume that n samples are given as training sets: ![]()
Here yi=+1 or -1, to find an optimal hyperplane, so that the points in the training set are as far as possible from the classification surface, that is, the classification surface that makes M=2/‖ω‖ the largest is the optimal classification surface. For linearly separable cases, find the optimal hyperplane: 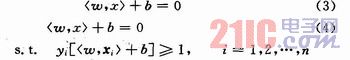
That is to solve the following quadratic programming problem: ![]()
For this quadratic programming problem, the equation (5) can be transformed into its dual form by the Lagrange multiplier method: 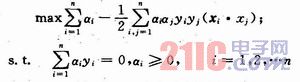
Let [a1 a2 ... a3] be the solution of the quadratic optimization problem. It can be proved that only a small part of ai is not 0, the corresponding xi is the support vector, ai is the corresponding Lagrange coefficient, and b is the constant (threshold). Then the optimal hyperplane equation is: ![]()
The classification rules for the optimal hyperplane are: ![]()
For linear indivisible, introduce a non-negative slack variable ξi in conditional equation (5), and the original constraint condition is changed to: ![]()
The corresponding objective function is changed to: ![]()
The dual problem of the optimal classification surface is changed to: 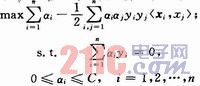
If ai>0, the corresponding xi is called Support Vector. Further, if O 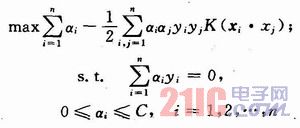
The found support vector fully describes the characteristics of the entire training data set, so that the linear classification of the SV set is equivalent to the classification of the entire data set. The detection flow chart is shown in Fig. 6. Shown.

1.5 Experimental Results and Analysis Three typical samples were selected in the experiment. The number of samples in each group was 200. The test was carried out on a PC. The results are shown in Table 1. Each sample has 6 or 5 digits, 3 or 4 of which represent hours and minutes, and 2 of which represent seconds.
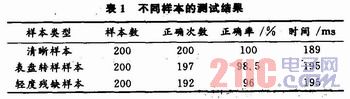
It can be seen from Table 1 that in the case of better binarization and clear numbers, the recognition rate reaches 100%. For samples with slight punctual noise and slight breaks, the recognition rate is also high, but the number exists. In the case of a defective sample, the recognition rate has decreased. In terms of recognition time, the full-screen number (6 or 5 digits) has a recognition time of less than 200 ms, which is significantly lower than the fastest change time of the instrument number of 1 000 ms.
2 Conclusion The main research method is the automatic interpretation method of digital instrument, which lays a foundation for the automatic identification of the instrument on the instrument panel. Firstly, the digital instrument collected is preprocessed, including image graying, binarization, and noise cancellation. Referring to the existing digital recognition algorithm, this paper mainly uses the vertical projection method to segment each character, and then extracts the block statistical features for each of the divided characters. Finally, the SVM training samples are used to realize the corresponding digital character recognition, and finally the reading of the digital meter is read. The method is simple, real-time and reliable, and is an ideal identification algorithm with certain application value.
We eliminate tooling costs and save customers money by offering hundreds and hundreds of stock overmolds. For highly customized molded cable manufacturing projects, our advanced technology allows us to produce custom overmolds at a price and quality level that clearly sets us ahead of the competition.
Custom molded wire assembly, overmolded IP67/68 connectors assembling,customized waterproofing cable assembly
ETOP WIREHARNESS LIMITED , http://www.etopwireharness.com